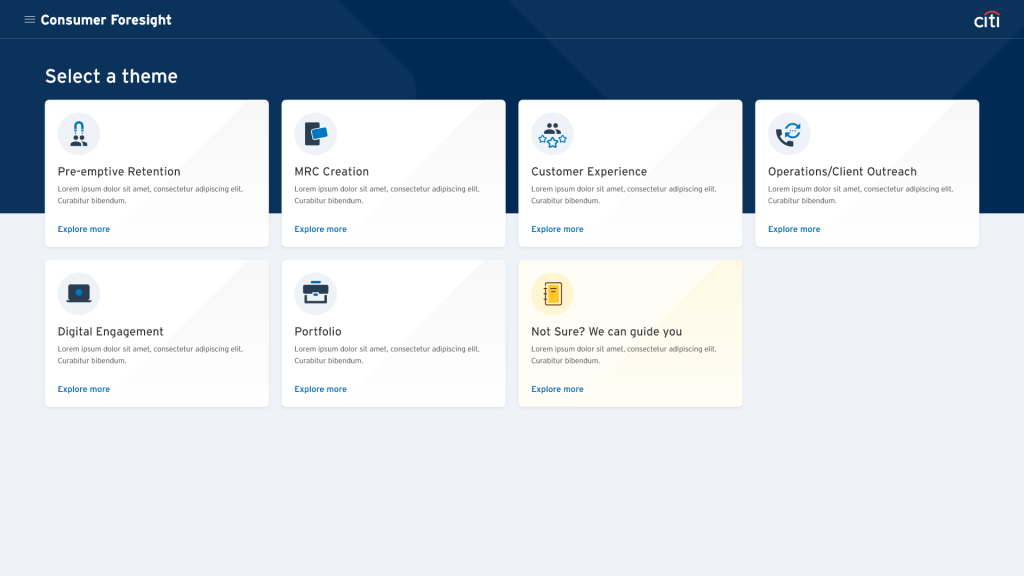
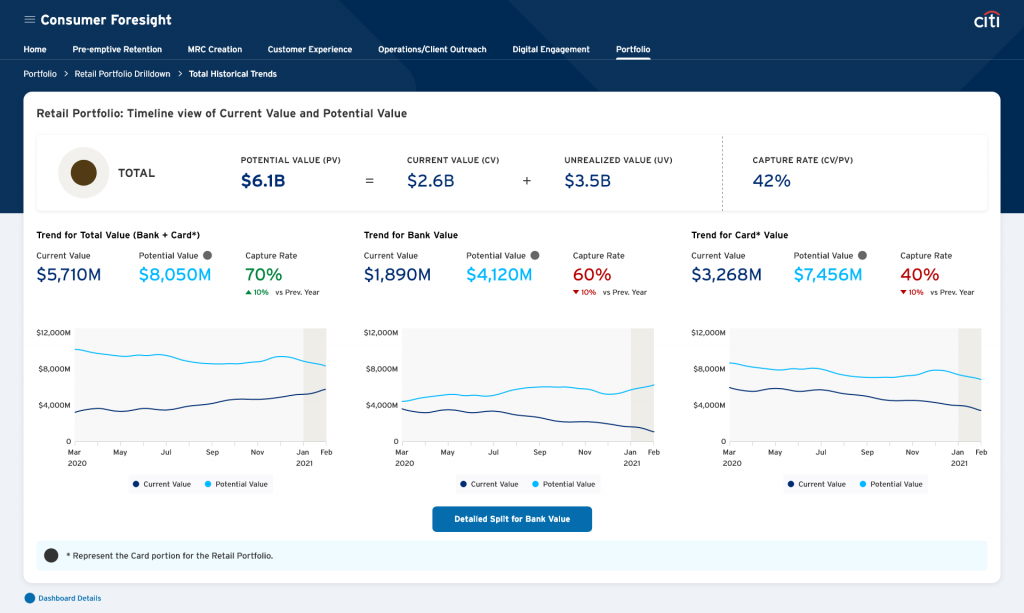
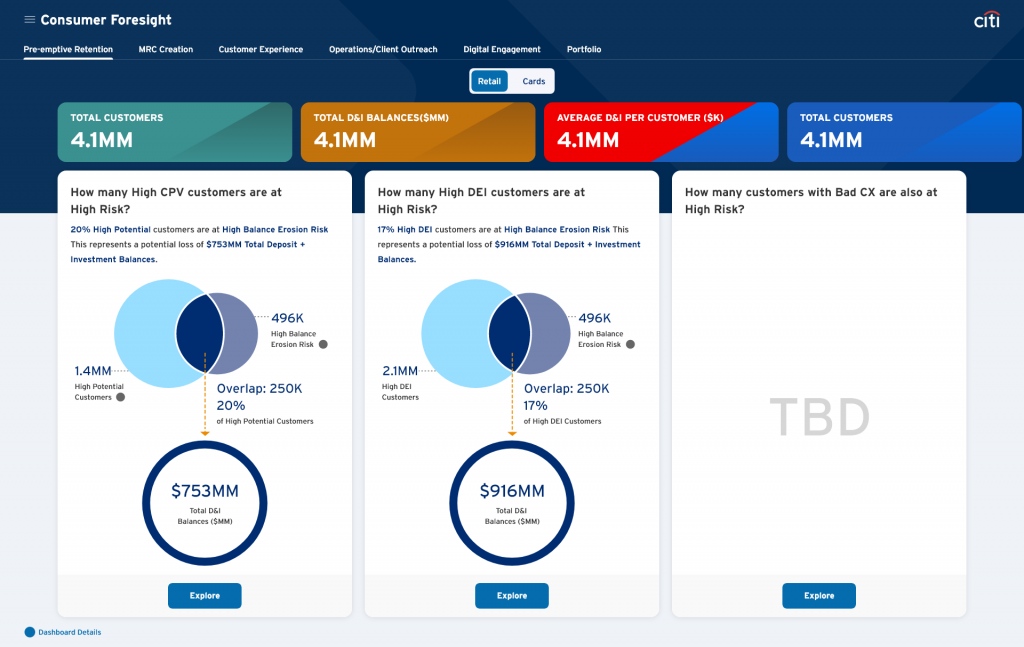
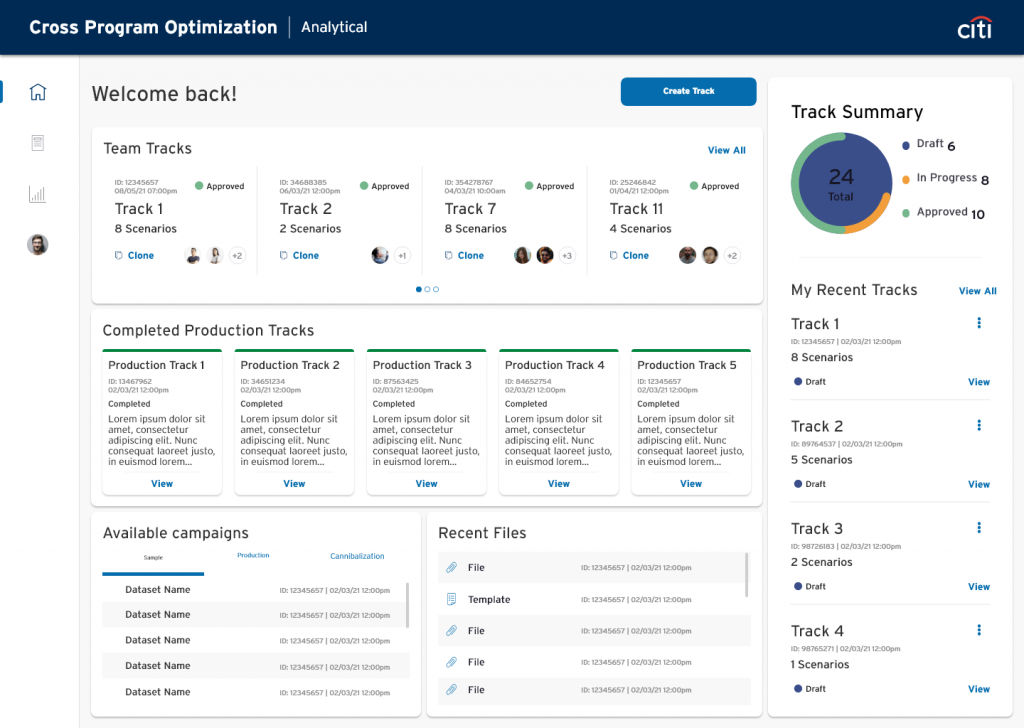
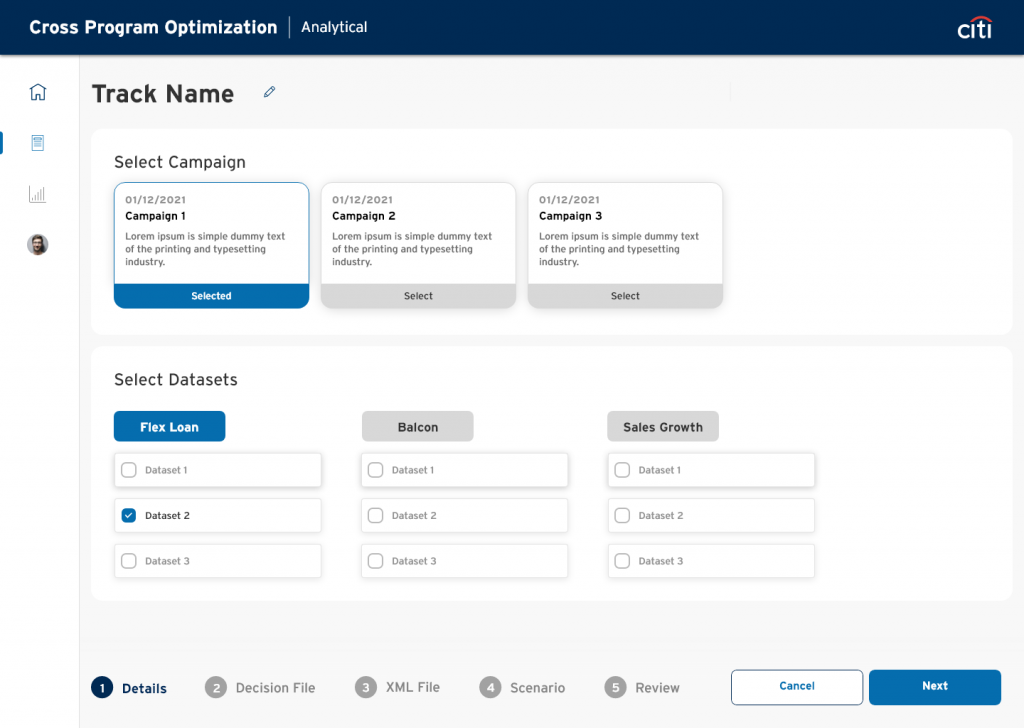
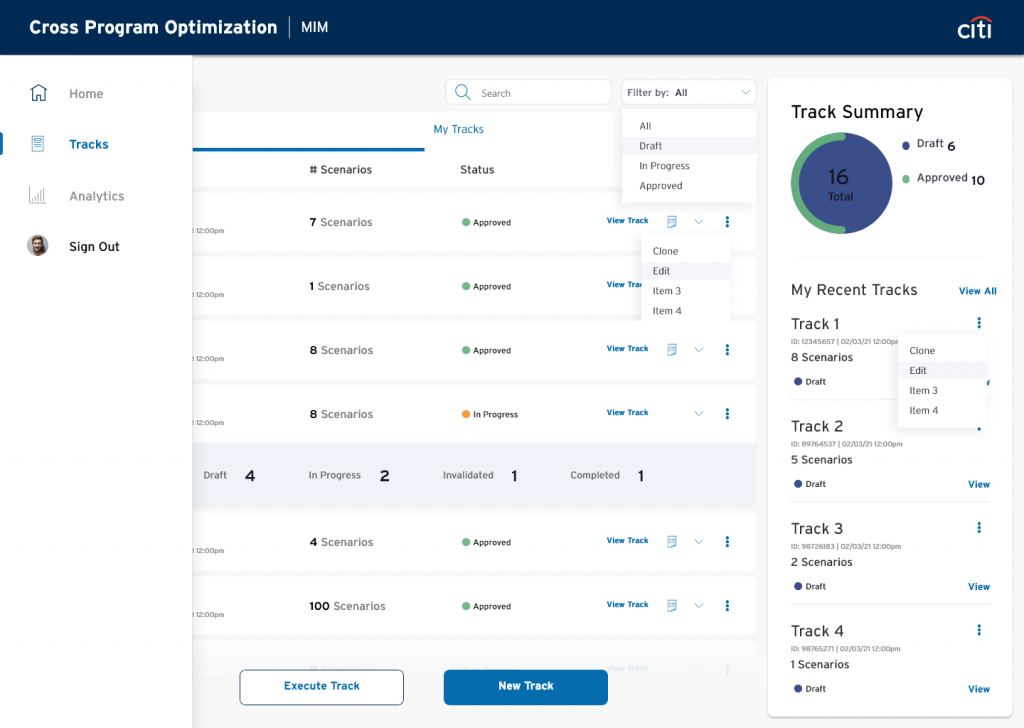
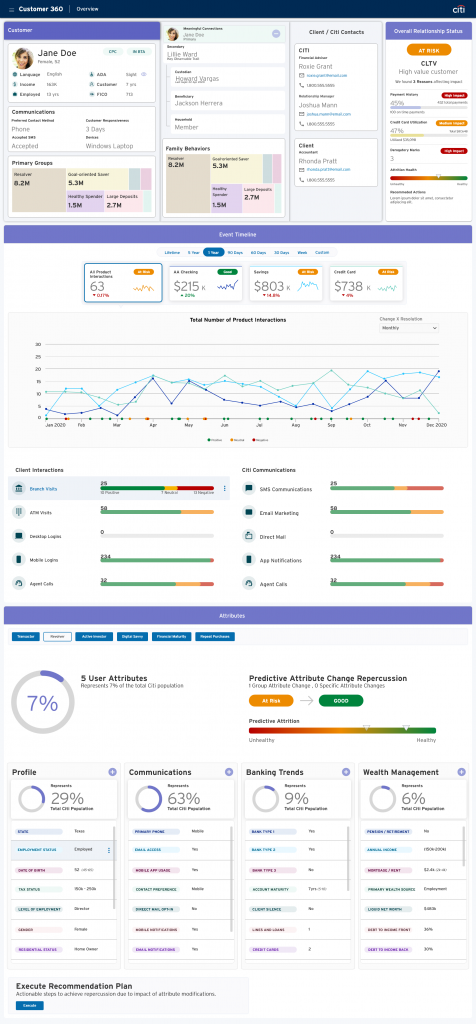
Citi – Dashboards and Data Visualizations

You may also like
Designing the Right Way
Everyone will have there opinions and preferences about designs and interactions. Sometimes when you have competing approaches you may have
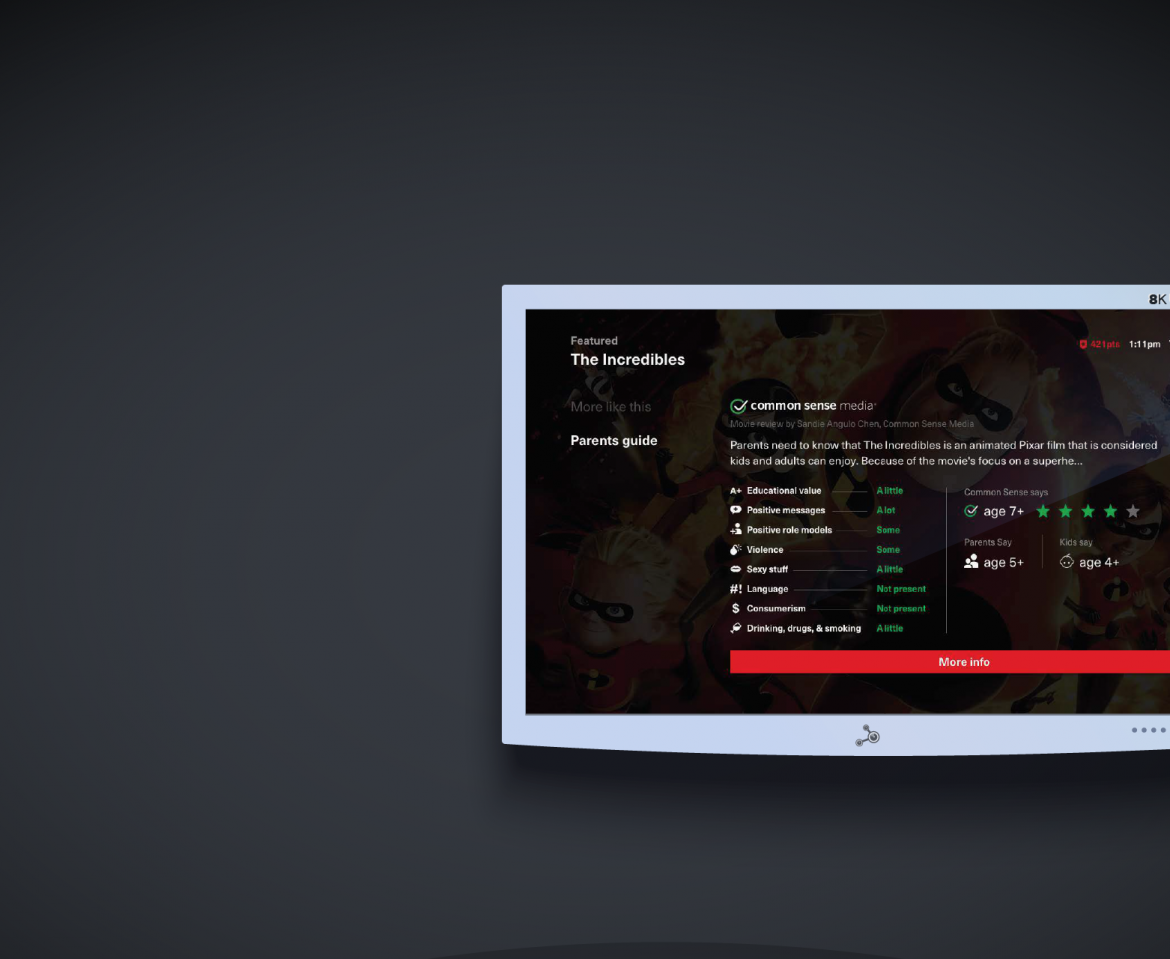
Making Common Sense
A At Verizon, we partnered with a company called Common Sense Media, the nation’s leading nonprofit organization dedicated to improvin